

To access the Student Reports, press the Student menu and then press the Reports sub menu as shown above in the application.
In the Reports menu, you will find five student-based reports that when pressed will present, in a separate browser tab, a report control. After satisfying the report filters, pressing the View Report button will render the report. Once the report is rendered, you will be able to export the report to Microsoft Word, Excel, PowerPoint, a PDF, Tiff, MHTML (web archive), CSV (comma delimited), XML file with report data, and a Data Feed.
The following describes each student report 1 through 5, its associated filters, and a sample of the rendered report.
(1) Student Project Detail Report - Report-005
This report shows a single project at a time for the student by project type, school year, test subject name, and project name. The filters work differently than any other report. Since only one project report can be rendered at a time, so it is with the report filters. For example, you must satisfy the Project Type before you can satisfy the School Year filter and so forth. If you try to press a filter before satisfying the filter preceding it, the action is prohibited.

The following describes each field a through e and how it is used in the report as shown above.
(a) Project Type is a dropdown list that allows you to choose a single project type.
(b) School Year is a dropdown list that allows you to choose a single school year.
(c) Test Subject Name is a dropdown list that allows you to choose a single test subject name.
(d) Project Name is a dropdown list that allows you to choose a single project name.
(e) View Report when pressed will render the report.
Press to see a sample of the Student Projects Detail Report report.
Based on the report example above (Press the Press link to see report), the following shows what the report displays in the screenshot below.
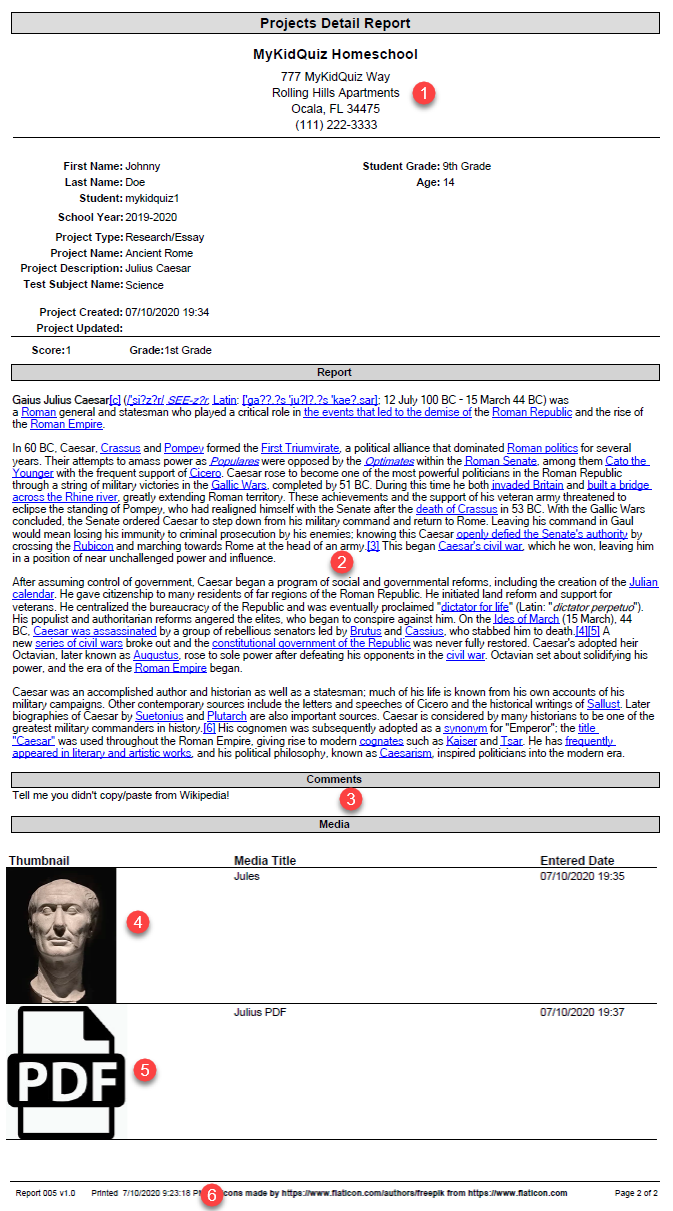
(1) The header of the report shows the School Profile along with values selected in the report parameters before rendering the report.
(2) The report is the text entered by the teacher which is part of the student's project.
(3) The comments are the teacher's comments entered by the teacher.
(4) Media images are uploaded by the teacher which is part of the student's project.
(5) Media PDFs are uploaded by the teacher which is part of the student's project.
(6) A footer that displays the report name, version, printed date, and number of pages.
(2) Student Progress Detail Report - Report-006
This report shows the Student Progress Detail report that shows the current progress (grades/scores) of the student in all test subjects currently assigned within school year and date range.

The following describes each field a through f and how it is used in the report as shown above.
(a) School Year is a dropdown list that allows you to choose one school year. The default is set to the current school year selected in the dropdown list of the School Profile.
(b) Start Date is used in conjunction with the End Date to narrow down a specific period of time within the school year. The default is NULL, which means when checked, will ignore the date.
(c) End Date is used in conjunction with the Start Date to narrow down a specific period of time within the school year. The default is NULL, which means when checked, will ignore the date.
Note: If the Start Date is populated and the End Date is NULL, then all progress from the Start Date to the current date will be shown.
If the End Date is populated and the Start Date is NULL, then all progress from the beginning of time to the End Date will be shown.
(d) Weigh Grades is a dropdown list that includes test subject weighing when Yes is selected, and ignores weighing when No is selected. See the Test Subject help documentation that explains how weighing works.
(e) Hide Weight Row is a dropdown list that shows the weight row above the test subjects when Yes is selected, and hides the row when No is selected.
(f) View Report when pressed will render the report.
Note: If WErr appears beneath the Final Score and Grade column of the rendered report, it means two things:
1) Yes was selected in the Weigh Grades dropdown list.
2) A test or project was assigned to a test subject that has a weight value equal to zero. In other words, you can't calculate a percentage of a test subject where the weight value is not set. If weighing is intended, make sure the student has taken tests and projects against test subjects with an assigned weighed amount only, else choose No in the Weigh Grades dropdown list. See the Test Subject help documentation that explains how weighing works.
Press to see a sample of the Student Progress Detail (Weighed) report.
Note: Based on the report example above (Press the Press link to see report), the following shows how the weighing works.
For American History 101, Penelope received a total score of 71 in Quizzes, 30 in Tests, 80 in Exams, 94 in Class Work, 75 in Book Reports, 10 in Research/Essays, and 100 in Presentations. The Category Weight for each column is displayed above the score. If the Category Weight = 0, then N/A should be displayed as the score and will be ignored when determining the Final Score. If the Category Weight is greater than zero and its score is equal to zero, then the Category Weight will be added directly to the Final Score.
Based on the sample report above, here is the formula that determines the Final Score:
Quizzes: (10/100) * 26 = 2.6 +
Tests: (30/100) * N/A = 30 **Note: When assignments not associated with subject, add the weight category +
Exams: (20/100) * 80 = 16 +
Class Work: (10/100) * 94 = 9.4 +
Book Reports: (10/100) * 75 = 7.5 +
Research/Essays: (10/100) * 10 = 1 +
Presentations: (10/100) * 100 = 10 = 76.5 (C)
Based on the report example above **Student Progress Detail (Weighed) (Press the Press link to see report), the following shows what the report displays in the screenshot below.

(1) The header of the report shows the School Profile along with values selected in the report parameters before rendering the report.
(2) The Category Weights for each test subject.
(3) 10 columns representing the test subject name, calculated score (based on weighing) for quizzes, tests, exams, class work, book reports, research/essays, and presentations), final score, which is a tally of all test/project types divided by the number of test/project types (7), and the associated grade.
(4) A footer that displays the report name, version, printed date, and number of pages.
Press to see a sample of the Student Progress Detail (Not Weighed) report.
(3) Student Test Listing Report - Report-011
This report shows the Student Test Listing report for the student for all tests taken by School Years, Test Types, and Test Subject Names.

The following describes each field a through d and how it is used in the report as shown above.
(a) School Years is a dropdown list that allows you to choose multiple school years. The current school year is selected by default.
(b) Test Subject Names is a dropdown list that allows you to choose multiple test subject names.
(c) Test Types is a dropdown list that allows you to choose multiple test types.
(d) View Report when pressed will render the report.
Press to see a sample of the Student Test Listing report.
Based on the report example above (Press the Press link to see report), the following shows what the report displays in the screenshot below.

(1) The header of the report shows the School Profile along with values selected in the report parameters before rendering the report.
(2) 11 sortable columns representing the student, school year, student test entered date, test type, test subject name, score, grade, test created date, student test completed date, student test graded date, and test name.
(3) A total field that displays the total number of rows displayed.
(4) A footer that displays the report name, version, printed date, and number of pages.
(4) Student Project Listing Report - Report-012
This report shows the Student Project Listing report for the student for all projects entered by the Teacher by School Years, Project Types, and Test Subject Names.

The following describes each field a through d and how it is used in the report as shown above.
(a) School Years is a dropdown list that allows you to choose multiple school years. The current school year is selected by default.
(b) Test Subject Names is a dropdown list that allows you to choose multiple test subject names.
(c) Project Types is a dropdown list that allows you to choose multiple project types.
(d) View Report when pressed will render the report.
Press to see a sample of the Student Project Listing report.
Based on the report example above (Press the Press link to see report), the following shows what the report displays in the screenshot below.

(1) The header of the report shows the School Profile along with values selected in the report parameters before rendering the report.
(2) 8 sortable columns representing the student, school year, entered date, project type, test subject name, score, grade, and project name.
(3) A total field that displays the total number of rows displayed.
(4) A footer that displays the report name, version, printed date, and number of pages.
(5) Incomplete Test Listing Report - Report-016
This report shows the Incomplete Test Listing report of all tests assigned to students that have not been started or have not been completed (In Progress) by Students, Test Subject Names, Test Types, and Assignment Status.

The following describes each field a through d and how it is used in the report as shown above.
(a) Test Types is a dropdown list that allows you to choose multiple test types. All items are selected by default.
(b) Assignment Status is a dropdown list that allows you to choose between Both, Not Started, or In Progress. Both is selected by default.
(c) Test Subject Names is a dropdown list that allows you to choose multiple test subject names. All items are selected by default.
(d) View Report when pressed will render the report.
Press to see a sample of the Incomplete Test Listing report.
Based on the report example above (Press the Press link to see report), the following shows what the report displays in the screenshot below.

(1) The header of the report shows the School Profile along with values selected in the report parameters before rendering the report.
(2) 7 sortable columns representing the student, test type, test subject name, status, create date, test name, and date due.
(3) A total field that displays the total number of rows displayed.
(4) A footer that displays the report name, version, printed date, and number of pages.
(6) Report Icon and Tooltip
To the left of each report link (For Example: Report 016), is a report icon. Hovering over this icon will reveal a tooltip describing the descriptive name of the report.