

To access the Teacher Reports, press the Teacher menu and then press the Reports sub menu as shown above in the application.
In the Reports menu, you will find eight teacher-based reports that when pressed will present, in a separate browser tab, a report control. After satisfying the report filters, pressing the View Report button will render the report. Once the report is rendered, you will be able to export the report to Microsoft Word, Excel, PowerPoint, a PDF, Tiff, MHTML (web archive), CSV (comma delimited), XML file with report data, and a Data Feed.
The following describes each teacher report 1 through 8, its associated filters, and a sample of the rendered report. Step 9 describes the report icon/tooltip.
(1) Student Progress Detail Report - Report-003
This report shows the Student Progress Detail report that shows the current progress (grades/scores) of a student in all test subjects currently assigned within school year and date range.
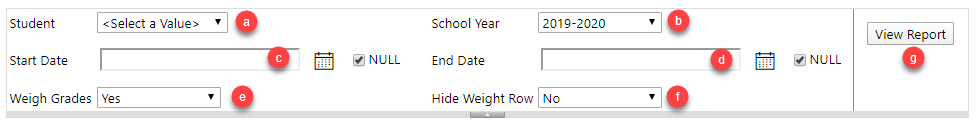
The following describes each field a through g and how it is used in the report as shown above.
(a) Student is a dropdown list that allows you to choose one student.
(b) School Year is a dropdown list that allows you to choose one school year. The default is set to the current school year selected in the dropdown list of the School Profile.
(c) Start Date is used in conjunction with the End Date to narrow down a specific period of time within the school year. The default is NULL, which means when checked, will ignore the date.
(d) End Date is used in conjunction with the Start Date to narrow down a specific period of time within the school year. The default is NULL, which means when checked, will ignore the date.
Note: If the Start Date is populated and the End Date is NULL, then all progress from the Start Date to the current date will be shown.
If the End Date is populated and the Start Date is NULL, then all progress from the beginning of time to the End Date will be shown.
(e) Weigh Grades is a dropdown list that includes test subject weighing when Yes is selected, and ignores weighing when No is selected. See the Test Subject help documentation that explains how weighing works.
(f) Hide Weight Row is a dropdown list that shows the weight row above the test subjects when Yes is selected, and hides the row when No is selected.
(g) View Report when pressed will render the report.
Note: If WErr appears beneath the Final Score and Grade column of the rendered report, it means two things:
1) Yes was selected in the Weigh Grades dropdown list.
2) A test or project was assigned to a test subject that has a weight value equal to zero. In other words, you can't calculate a percentage of a test subject where the weight value is not set. If weighing is intended, make sure the student has taken tests and projects against test subjects with an assigned weighed amount only, else choose No in the Weigh Grades dropdown list. See the Test Subject help documentation that explains how weighing works.
Press to see a sample of the Student Progress Detail (Weighed) report.
Note: Based on the report example above (Press the Press link to see report), the following shows how the weighing works.
For American History 101, Penelope received a total score of 71 in Quizzes, 30 in Tests, 80 in Exams, 94 in Class Work, 75 in Book Reports, 10 in Research/Essays, and 100 in Presentations. The Category Weight for each column is displayed above the score. If the Category Weight = 0, then N/A should be displayed as the score and will be ignored when determining the Final Score. If the Category Weight is greater than zero and its score is equal to zero, then the Category Weight will be added directly to the Final Score.
Based on the sample report above, here is the formula that determines the Final Score:
Quizzes: (10/100) * 71 = 7.1 +
Tests: (30/100) * 30 = 9 +
Exams: (20/100) * 80 = 16 +
Class Work: (10/100) * 94 = 9.4 +
Book Reports: (10/100) * 75 = 7.5 +
Research/Essays: (10/100) * 10 = 1 +
Presentations: (10/100) * 100 = 10 = 60 (D-)
Based on the report example above **Student Progress Detail (Weighed) (Press the Press link to see report), the following shows what the report displays in the screenshot below.

(1) The header of the report shows the School Profile along with values selected in the report parameters before rendering the report.
(2) The Category Weights for each test subject.
(3) 10 columns representing the test subject name, calculated score (based on weighing) for quizzes, tests, exams, class work, book reports, research/essays, and presentations), final score, which is a tally of all test/project types divided by the number of test/project types (7), and the associated grade.
(4) A footer that displays the report name, version, printed date, and number of pages.
Press to see a sample of the Student Progress Detail (Not Weighed) report.
(2) Student Test Listing Report - Report-004
This report shows the Student Test Listing report of all tests taken by students by Students, School Years, Test Types, and Test Subject Names.

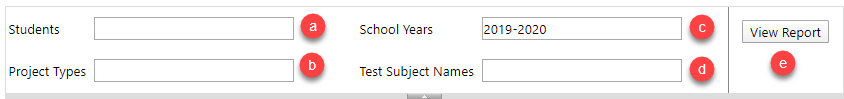
The following describes each field a through e and how it is used in the report as shown above.
(a) Students is a dropdown list that allows you to choose multiple students.
(b) Test Types is a dropdown list that allows you to choose multiple test types.
(c) School Years is a dropdown list that allows you to choose multiple school years. The current school year is selected by default.
(d) Test Subject Names is a dropdown list that allows you to choose multiple test subject names.
(e) View Report when pressed will render the report.
Press to see a sample of the Student Test Listing report.
Based on the report example above (Press the Press link to see report), the following shows what the report displays in the screenshot below.

(1) The header of the report shows the School Profile along with values selected in the report parameters before rendering the report.
(2) 11 sortable columns representing the student, school year, student test entered date, test type, test subject name, score, grade, test created date, student test completed date, student test graded date, and test name.
(3) A total field that displays the total number of rows displayed.
(4) A footer that displays the report name, version, printed date, and number of pages.
(3) Student Project Listing Report - Report-013
This report shows the Student Project Listing report of all projects by the students and entered by the Teacher by Students, School Years, Project Types, and Test Subject Names.
The following describes each field a through e and how it is used in the report as shown above.
(a) Students is a dropdown list that allows you to choose multiple students.
(b) Project Types is a dropdown list that allows you to choose multiple project types.
(c) School Years is a dropdown list that allows you to choose multiple school years. The current school year is selected by default.
(d) Test Subject Names is a dropdown list that allows you to choose multiple test subject names.
(e) View Report when pressed will render the report.
Press to see a sample of the Student Project Listing report.
Based on the report example above (Press the Press link to see report), the following shows what the report displays in the screenshot below.

(1) The header of the report shows the School Profile along with values selected in the report parameters before rendering the report.
(2) 8 sortable columns representing the student, school year, entered date, project type, test subject name, score, grade, and project name.
(3) A total field that displays the total number of rows displayed.
(4) A footer that displays the report name, version, printed date, and number of pages.
(4) Incomplete Test Listing Report - Report-015
This report shows the Incomplete Test Listing report of all tests assigned to students that have not been started or have not been completed (In Progress) by Students, Test Subject Names, Test Types, and Assignment Status.

The following describes each field a through e and how it is used in the report as shown above.
(a) Students is a dropdown list that allows you to choose multiple students.
(b) Test Subject Names is a dropdown list that allows you to choose multiple test subject names. All items are selected by default.
(c) Test Types is a dropdown list that allows you to choose multiple test types. All items are selected by default.
(d) Assignment Status is a dropdown list that allows you to choose between Both, Not Started, or In Progress. Both is selected by default.
(e) View Report when pressed will render the report.
Press to see a sample of the Incomplete Test Listing report.
Based on the report example above (Press the Press link to see report), the following shows what the report displays in the screenshot below.

(1) The header of the report shows the School Profile along with values selected in the report parameters before rendering the report.
(2) 7 sortable columns representing the student, test type, test subject name, status, create date, test name, and date due.
(3) A total field that displays the total number of rows displayed.
(4) A footer that displays the report name, version, printed date, and number of pages.
(5) Student Test Graded Audit Listing Report - Report-017
This report shows the Student Test Graded Audit Listing report of all student-graded tests by Students, Test Types, Graded More Than Once, School Years, and Test Subject Names. The purpose of this report is to show a history of when student tests were graded, and how many times specific student tests were graded (Choosing Yes in Graded More Than Once dropdown list), even if a student test is later deleted by the teacher.

The following describes each field a through e and how it is used in the report as shown above.
(a) Students is a dropdown list that allows you to choose multiple students.
(b) Test Types is a dropdown list that allows you to choose multiple test types. All items are selected by default.
(c) Graded More Than Once is a dropdown list that allows you to choose between Yes or No. Yes is selected by default.
(d) School Years is a dropdown list that allows you to choose multiple school years. The current school year is selected by default.
(e) View Report when pressed will render the report.
Press to see a sample of the Incomplete Test Listing report.
Based on the report example above (Press the Press link to see report), the following shows what the report displays in the screenshot below.
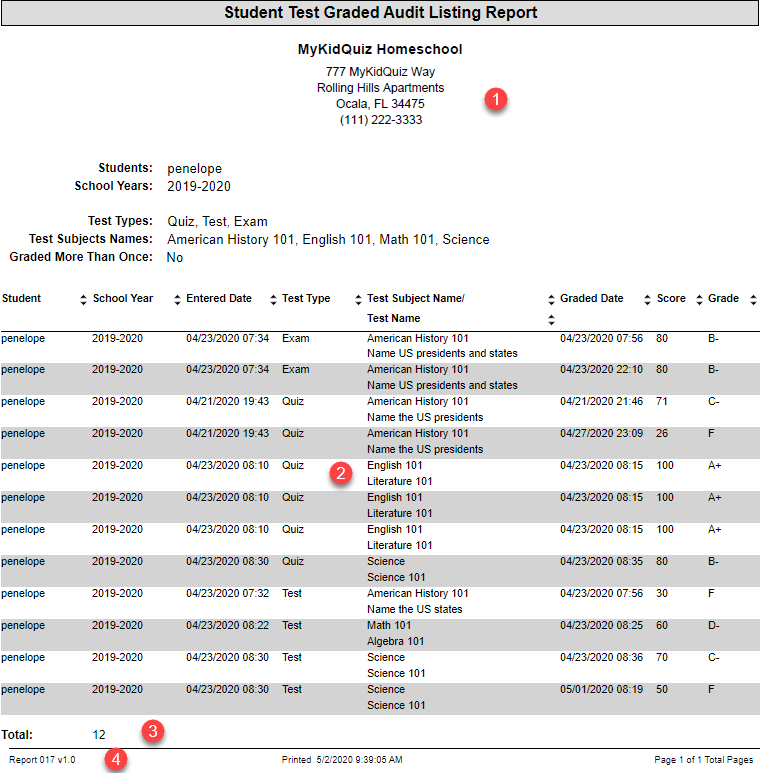
(1) The header of the report shows the School Profile along with values selected in the report parameters before rendering the report.
(2) 9 sortable columns representing the student, school year, entered date, test type, test subject name, graded date, score, grade, and test name.
(3) A total field that displays the total number of rows displayed.
(4) A footer that displays the report name, version, printed date, and number of pages.
(6) Student Report Card by Quarter - Report-018
This report shows the Student Report Card by Quarter report that displays the (grades/scores) of a student in all test subjects currently assigned within school year and quarter.

The following describes each field a through g and how it is used in the report as shown above.
(a) Student is a dropdown list that allows you to choose one student.
(b) School Year is a dropdown list that allows you to choose one school year. The default is set to the current school year selected in the dropdown list of the School Profile.
(c) Quarter Date 1 is used in conjunction with the other quarter dates to narrow down a specific period of time within the school year. The range between each quarter will represent a column on the report. The default is set to September 1st of the beginning of the current School Year year set in the School Profile.
(d) Quarter Date 2 is used in conjunction with the other quarter dates to narrow down a specific period of time within the school year. The range between each quarter will represent a column on the report. The default is set to November 1st of the beginning of the current School Year year set in the School Profile.
(e) Quarter Date 3 is used in conjunction with the other quarter dates to narrow down a specific period of time within the school year. The range between each quarter will represent a column on the report. The default is set to January 1st of the latter part of the current School Year year set in the School Profile.
(f) Quarter Date 4 is used in conjunction with the other quarter dates to narrow down a specific period of time within the school year. The range between each quarter will represent a column on the report. The default is set to March 1st of the latter par of the current School Year year set in the School Profile.
Note: You can select any date you prefer as long as the 4 quarter dates progress sequentially and fall within the school year calendar.
(g) Weigh Grades is a dropdown list that includes test subject weighing when Yes is selected (which is the default), and ignores weighing when No is selected. See the Test Subject help documentation that explains how weighing works.
(h) Hide Score Columns is a dropdown list that shows the score columns when No is selected (which is the default). Select Yes to hide the scores.
(i) Minimal Profile is a dropdown list that hides the School Profile header when No is selected (which is the default). Select Yes to show the school profile.
(j) Hide Weight Row is a dropdown list that shows the weight row above the test subjects when No is selected (which is the default). Select Yes to hide the rows.
(k) View Report when pressed will render the report.
Note: If WErr appears beneath the Total Final Score and Total Final Grade column of the rendered report, it means two things:
1) Yes was selected in the Weigh Grades dropdown list.
2) A test or project was assigned to a test subject that has a weight value equal to zero. In other words, you can't calculate a percentage of a test subject where the weight value is not set. If weighing is intended, make sure the student has taken tests and projects against test subjects with an assigned weighed amount only, else choose No in the Weigh Grades dropdown list. See the Test Subject help documentation that explains how weighing works.
Press to see a sample of the Student Report Card by Quarter report.
Note: See the documentation of the Student Progress Detail Report above - (1) for an explanation on how weighing works.
***** The following shows what the report displays in the screenshot below.

(1) The header of the report shows the School Profile along with values selected in the report parameters before rendering the report.
(2) This is for display purposes only that explain how weighing works. Hide if not weighing.
(3) These columns represent the total score for the quarter. Hide if not needed.
(4) These columns represent the total grade for the quarter.
(5) This column represents the total score for all the quarters. Hide if not needed.
(6) This column represents the total grade for all the quarters.
(7) A footer that displays the report name, version, printed date, and number of pages.
(7) Student Report Card by Semester - Report-019
This report shows the Student Report Card by Semester report that displays the (grades/scores) of a student in all test subjects currently assigned within school year and semester.

The following describes each field a through g and how it is used in the report as shown above.
(a) Student is a dropdown list that allows you to choose one student.
(b) School Year is a dropdown list that allows you to choose one school year. The default is set to the current school year selected in the dropdown list of the School Profile.
(c) Semester Date 1 is used in conjunction with Semester Date 2 to narrow down a specific period of time within the school year. The range between each semester will represent a column on the report. The default is set to September 1st of the beginning of the current School Year year set in the School Profile.
(d) Semester Date 2 is used in conjunction with Semester Date 1 to narrow down a specific period of time within the school year. The range between each semester will represent a column on the report. The default is set to January 1st of the latter part of the current School Year year set in the School Profile.
Note: You can select any date you prefer as long as the 4 quarter dates progress sequentially and fall within the school year calendar.
(e) Weigh Grades is a dropdown list that includes test subject weighing when Yes is selected (which is the default), and ignores weighing when No is selected. See the Test Subject help documentation that explains how weighing works.
(f) Hide Score Columns is a dropdown list that shows the score columns when No is selected (which is the default). Select Yes to hide the scores.
(g) Minimal Profile is a dropdown list that hides the School Profile header when No is selected (which is the default). Select Yes to show the school profile.
(h) Hide Weight Row is a dropdown list that shows the weight row above the test subjects when No is selected (which is the default). Select Yes to hide the rows.
(i) View Report when pressed will render the report.
Note: If WErr appears beneath the Total Final Score and Total Final Grade column of the rendered report, it means two things:
1) Yes was selected in the Weigh Grades dropdown list.
2) A test or project was assigned to a test subject that has a weight value equal to zero. In other words, you can't calculate a percentage of a test subject where the weight value is not set. If weighing is intended, make sure the student has taken tests and projects against test subjects with an assigned weighed amount only, else choose No in the Weigh Grades dropdown list. See the Test Subject help documentation that explains how weighing works.
Press to see a sample of the Student Report Card by Semester report.
Note: See the documentation of the Student Progress Detail Report above - (1) for an explanation on how weighing works.
***** The following shows what the report displays in the screenshot below.

(1) The header of the report shows the School Profile along with values selected in the report parameters before rendering the report.
(2) This is for display purposes only that explain how weighing works. Hide if not weighing.
(3) These columns represent the total score for the semester. Hide if not needed.
(4) These columns represent the total grade for the semester.
(5) This column represents the total score for all the semesters. Hide if not needed.
(6) This column represents the total grade for all the semesters.
(7) A footer that displays the report name, version, printed date, and number of pages.
(8) School Profile Report - Report-021
This report shows the School Profile's current state as entered by the teacher.
Press to see a sample of the School Profile report.
Based on the report example above (Press the Press link to see report), the following shows what the report displays in the screenshot below.

(1) The header of the report shows the School Profile.
(2) Teacher checkboxes that reflects:
a) Teacher Email Notification if colored black means the teacher wishes to receive email notifications about their students activities in regards to their assigned tests.
b) Student Test Started if colored black means the teacher wishes to be notified by email when a student begins an assigned test.
c) Student Test Complete if colored black means the teacher wishes to be notified by email when a student completes an assigned test.
d) Student Test Graded if colored black means the teacher wishes to be notified by email when a student's test is graded by the teacher.
(3) Student checkboxes that reflects:
a) Student Email Notification if colored black means the student will receive email notifications about their student test activities as long as the student's email notification is also checked in the student's profile maintained by the teacher.
b) Student Test Assigned if colored black means the student will receive email notifications that a test has been assigned to them by the teacher as long as their email notification is also checked in the student's profile maintained by the teacher
c) Student Test Graded if colored black means the student will receive email notifications when their student test was graded by the teacher as long as their email notification is also checked in the student's profile maintained by the teacher
d) Project Graded if colored black means the student will receive email notifications when their student project was entered and graded by the teacher as long as their email notification is also checked in the student's profile maintained by the teacher
(4) A footer that displays the report name, version, printed date, and number of pages.
(9) Report Icon and Tooltip
To the left of each report link (For Example: Report 015), is a report icon. Hovering over this icon will reveal a tooltip describing the descriptive name of the report.